📈 Backtest Results (2001–2024)
A transparent, year-by-year record of True North Alpha’s performance. This page shows every stock selected by the model and how the portfolio performed relative to the TSX.
Methodology Overview
- Universe: Large-cap TSX constituents as of each year-end
- Selection Criteria: Top 10–14 stocks each year based on a proprietary composite of valuation expansion, earnings strength, and price momentum:
- Portfolio Construction: Equal-weighted
- Rebalance Frequency: Annual (held for 12 months)
True North Alpha follows a fully systematic, non-discretionary methodology. It selects 10–14 TSX-listed large-cap equities annually based on a composite score incorporating valuation expansion relative to historical averages, earnings strength, and momentum. Portfolios are equal-weighted and rebalanced annually. No forecasts, thematic overlays, or subjective inputs are used.
Summary: Does It Work?
The strategy’s historical results demonstrate consistent outperformance across multiple time periods and market conditions.
📊 Long-Term Outperformance
Since 2000, the True North Alpha model has delivered an annualized total return of 12.2%, significantly ahead of the TSX Index at 7.2%. The model outperformed the benchmark in 19 out of the last 24 calendar years, reflecting a high hit rate and robust relative performance.
The model’s return profile is also not limited to early-cycle gains or a single period of strength. Over the most recent 5-year period, the strategy returned 16.1% annualized vs. 11.1% for the TSX. Over 10 years, it produced 11.6% vs. 8.7% for the index. This persistence across timeframes suggests the model capturing structural alpha rather than temporary, cycle-driven market anomalies.
📉 Risk-Adjusted Metrics
- Sharpe Ratio: 0.69 vs. TSX at 0.33
- Information Ratio: 0.80
- Volatility (Std. Dev.): 14.7% vs. 15.8% for TSX
While the strategy has experienced periods of underperformance—as any active approach will—the average downside in those years has been limited (~3.1% on average), whereas the average excess return in outperforming years was meaningfully higher (~7.1%). This asymmetry contributes to the strategy’s attractive risk-adjusted profile.
All returns are presented on a total return basis.
True North Alpha | TSX | Beat TSX? | |
2001 | 3.9% | -12.6% | 16.5% |
2002 | 1.9% | -12.4% | 14.3% |
2003 | 35.3% | 26.6% | 8.7% |
2004 | 17.2% | 14.5% | 2.8% |
2005 | 31.5% | 24.0% | 7.5% |
2006 | 16.7% | 17.2% | -0.5% |
2007 | 26.6% | 9.8% | 16.8% |
2008 | -30.0% | -33.0% | 3.0% |
2009 | 27.4% | 35.0% | -7.6% |
2010 | 17.5% | 17.6% | -0.1% |
2011 | -3.5% | -8.7% | 5.3% |
2012 | 8.2% | 7.2% | 1.0% |
2013 | 23.5% | 13.0% | 10.5% |
2014 | 18.9% | 10.5% | 8.4% |
2015 | -5.3% | -8.3% | 3.0% |
2016 | 16.9% | 21.1% | -4.2% |
2017 | 6.4% | 9.1% | -2.7% |
2018 | 0.7% | -8.9% | 9.6% |
2019 | 19.6% | 22.9% | -3.3% |
2020 | 8.9% | 5.6% | 3.3% |
2021 | 31.3% | 25.2% | 6.2% |
2022 | -0.3% | -5.8% | 5.5% |
2023 | 14.1% | 11.8% | 2.3% |
2024 | 29.7% | 21.7% | 8.0% |
Average | 13.2% | 8.5% | |
Annualized return (since 2000) | 12.2% | 7.2% | |
Sharpe Ratio | 0.69 | 0.33 | |
Information Ratio | 0.80 | ||
Volatility (STD. DeV.) | 0.147 | 0.158 | |
Annualized return (5YR) | 16.1% | 11.1% | |
Annualized return (10Y) | 11.6% | 8.7% |
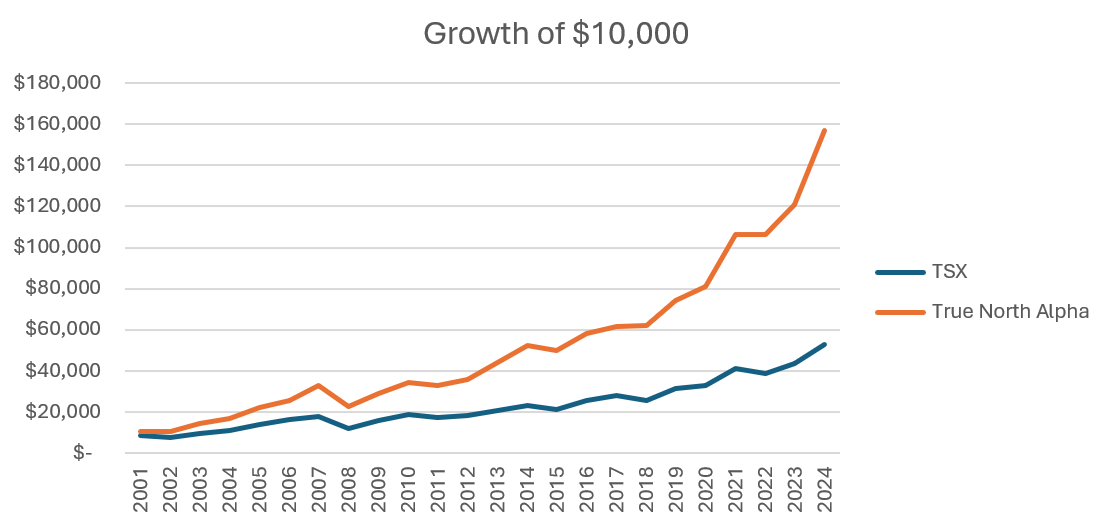
📉 Growth of $10,000 (2000–2024)
A $10,000 investment following the True North Alpha strategy would have grown to $157,000+, compared to $52,000 in the TSX — nearly 3x the wealth over the same period.
|
TSX |
True North Alpha |
|
|
2001 |
$ 8,742 |
$ 10,393 |
|
2002 |
$ 7,656 |
$ 10,590 |
|
2003 |
$ 9,692 |
$ 14,330 |
|
2004 |
$ 11,095 |
$ 16,800 |
|
2005 |
$ 13,761 |
$ 22,096 |
|
2006 |
$ 16,131 |
$ 25,782 |
|
2007 |
$ 17,713 |
$ 32,648 |
|
2008 |
$ 11,864 |
$ 22,839 |
|
2009 |
$ 16,022 |
$ 29,102 |
|
2010 |
$ 18,838 |
$ 34,202 |
|
2011 |
$ 17,195 |
$ 33,016 |
|
2012 |
$ 18,430 |
$ 35,707 |
|
2013 |
$ 20,822 |
$ 44,088 |
|
2014 |
$ 23,018 |
$ 52,435 |
|
2015 |
$ 21,102 |
$ 49,667 |
|
2016 |
$ 25,551 |
$ 58,043 |
|
2017 |
$ 27,871 |
$ 61,766 |
|
2018 |
$ 25,395 |
$ 62,226 |
|
2019 |
$ 31,208 |
$ 74,439 |
|
2020 |
$ 32,958 |
$ 81,033 |
|
2021 |
$ 41,247 |
$ 106,407 |
|
2022 |
$ 38,874 |
$ 106,095 |
|
2023 |
$ 43,471 |
$ 121,091 |
|
2024 |
$ 52,884 |
$ 157,052 |
🛡️ Important Note
As with any investment strategy, past performance is not indicative of future results. The results presented here are based on a historical backtest using fixed rules and assumptions. Returns are gross of taxes, fees, and transaction costs. This information is provided for illustrative and educational purposes only and does not constitute investment advice or a solicitation to buy or sell any security.
📅 Annual Stock Selections & Returns
Below is the full year-by-year selection history of the True North Alpha model, including total returns vs. the TSX. Each year represents a fresh rebalancing at the start of the year based on the model’s score.
2024
|
Company |
Return |
|
Alimentation Couche-Tard
Inc |
3.1% |
|
Brookfield Corp |
56.5% |
|
Cameco Corp |
29.6% |
|
Constellation Software
Inc/Can |
35.5% |
|
Hydro One Ltd |
14.8% |
|
Loblaw Cos Ltd |
49.2% |
|
Manulife Financial Corp |
57.5% |
|
Restaurant Brands
Internationa |
-6.5% |
|
Thomson Reuters Corp |
20.7% |
|
George Weston Ltd |
38.0% |
|
Waste Connections Inc |
25.5% |
|
Wheaton Precious Metals
Corp |
25.1% |
|
WSP Global Inc |
37.1% |
Total Return: 29.7%
TSX Total Return: 21.7%
Outperformance: +8.1%
2023
|
Company |
Return |
|
Cameco Corp |
86.5% |
|
Canadian Pacific Kansas
City L |
4.6% |
|
Cenovus Energy Inc |
-14.1% |
|
Dollarama Inc |
21.0% |
|
Hydro One Ltd |
13.0% |
|
Loblaw Cos Ltd |
8.8% |
|
Metro Inc/CN |
-7.0% |
|
Shaw Communications Inc |
4.6% |
|
Thomson Reuters Corp |
27.1% |
|
George Weston Ltd |
-0.3% |
|
CGI Inc |
21.6% |
|
Intact Financial Corp |
7.0% |
|
Waste Connections Inc |
11.1% |
Total Return: 14.1%
TSX Total Return: 11.8%
Outperformance: 2.3%
2022
|
Company |
Return |
|
Brookfield
Infrastructure Part |
-15.3% |
|
Brookfield Corp |
-30.5% |
|
Constellation Software
Inc/Can |
-9.7% |
|
Dollarama Inc |
25.5% |
|
Emera Inc |
-14.3% |
|
Fortis Inc/Canada |
-7.9% |
|
Loblaw Cos Ltd |
17.1% |
|
Shaw Communications Inc |
5.0% |
|
Waste Connections Inc |
4.8% |
|
George Weston Ltd |
16.4% |
|
Canadian National
Railway Co |
5.5% |
Total Return: -0.29%
TSX Total Return: -5.75%
Outperformance: 5.46%
2021
|
Company |
Return |
|
Algonquin Power & Utilities
Co |
-8.8% |
|
Brookfield Corp |
47.8% |
|
Canadian National
Railway Co |
12.9% |
|
Canadian Pacific Kansas
City L |
3.9% |
|
Constellation Software
Inc/Can |
42.4% |
|
Magna International Inc |
15.9% |
|
Nutrien Ltd |
59.9% |
|
Teck Resources Ltd |
58.7% |
|
Thomson Reuters Corp |
47.5% |
|
Waste Connections Inc |
33.0% |
Total Return: 31.3%
TSX Total Return: 25.2%
Outperformance: 6.16%
2020
|
Company |
Return |
|
Agnico Eagle Mines Ltd |
13.7% |
|
Brookfield Corp |
6.6% |
|
Franco-Nevada Corp |
20.0% |
|
Fortis Inc/Canada |
0.0% |
|
CGI Inc |
-7.1% |
|
National Bank of Canada |
4.1% |
|
Sun Life Financial Inc |
-0.5% |
|
Thomson Reuters Corp |
14.5% |
|
Waste Connections Inc |
11.5% |
|
Wheaton Precious Metals
Corp |
39.1% |
|
Loblaw Cos Ltd |
-4.4% |
Total Return: 8.86%
TSX Total Return: 5.61%
Outperformance: 3.25%
2019
|
Company |
Return |
|
Agnico Eagle Mines Ltd |
46.8% |
|
Brookfield Corp |
45.3% |
|
Cameco Corp |
-25.0% |
|
Franco-Nevada Corp |
41.7% |
|
CGI Inc |
30.1% |
|
Kinross Gold Corp |
40.0% |
|
Loblaw Cos Ltd |
11.6% |
|
Rogers Communications
Inc |
-5.1% |
|
Teck Resources Ltd |
-22.8% |
|
Waste Connections Inc |
17.3% |
|
CCL Industries Inc |
11.8% |
|
Constellation Software
Inc/Can |
48.5% |
|
Metro Inc/CN |
15.0% |
Total Return: 19.6%
TSX Total Return: 22.9%
Outperformance: -3.3%
2018
|
Company |
Return |
|
Bank of Montreal |
-7.9% |
|
Brookfield Corp |
-3.0% |
|
Canadian Tire Corp Ltd |
-11.0% |
|
Franco-Nevada Corp |
-3.4% |
|
CGI Inc |
22.3% |
|
National Bank of Canada |
-6.9% |
|
Rogers Communications
Inc |
12.5% |
|
Royal Bank of Canada |
-5.5% |
|
Toronto-Dominion
Bank/The |
-4.6% |
|
Waste Connections Inc |
14.5% |
|
CCL Industries Inc |
-13.1% |
|
Cameco Corp |
34.0% |
|
Canadian National
Railway Co |
-0.8% |
|
Constellation Software
Inc/Can |
15.3% |
|
Husky Energy Inc |
-18.7% |
|
Saputo Inc |
-11.9% |
Total Return: 0.74%
TSX Total Return: -8.88%
Outperformance: 9.63%
2017
|
Company |
Return |
|
Barrick Mining Corp |
-14.8% |
|
ARC Resources Ltd |
-33.9% |
|
Bank of Montreal |
8.0% |
|
Dollarama Inc |
60.2% |
|
Loblaw Cos Ltd |
-2.2% |
|
National Bank of Canada |
19.7% |
|
Saputo Inc |
-3.5% |
|
Toronto-Dominion
Bank/The |
15.2% |
|
Teck Resources Ltd |
24.9% |
|
Thomson Reuters Corp |
-3.8% |
|
CGI Inc |
6.0% |
|
Metro Inc/CN |
1.8% |
|
Ovintiv Inc |
7.0% |
|
TC Energy Corp |
5.2% |
Total Return: 6.41%
TSX Total Return: 9.08%
Outperformance: -2.67%
2016
|
Company |
Return |
|
Alimentation Couche-Tard
Inc |
0.5% |
|
BCE Inc |
13.7% |
|
Constellation Software
Inc/Can |
6.8% |
|
Dollarama Inc |
23.6% |
|
Franco-Nevada Corp |
28.6% |
|
CGI Inc |
16.3% |
|
Loblaw Cos Ltd |
10.0% |
|
Metro Inc/CN |
5.0% |
|
Suncor Energy Inc |
26.9% |
|
Thomson Reuters Corp |
16.0% |
|
Canadian Pacific Kansas
City L |
9.5% |
|
Saputo Inc |
45.5% |
Total Return: 16.9%
TSX Total Return: 21.1%
Outperformance: -4.2%
2015
|
Company |
Return |
|
Alimentation Couche-Tard
Inc |
25.6% |
|
BCE Inc |
5.3% |
|
Canadian National
Railway Co |
-1.7% |
|
Eldorado Gold Corp |
-41.9% |
|
Fortis Inc/Canada |
-0.5% |
|
Inter Pipeline Ltd |
-34.8% |
|
Loblaw Cos Ltd |
6.7% |
|
Metro Inc/CN |
26.2% |
|
Saputo Inc |
-3.6% |
|
TC Energy Corp |
-17.4% |
|
Canadian Pacific Kansas
City L |
-20.5% |
|
Enbridge Inc |
-20.4% |
|
George Weston Ltd |
8.3% |
Total Return: -5.28%
TSX Total Return: -8.33%
Outperformance: 3.05%
2014
|
Company |
Return |
|
Corp Shoppers Drug Mart |
5.0% |
|
Bausch Health Cos Inc |
33.5% |
|
Canadian National
Railway Co |
34.0% |
|
Canadian Pacific Kansas
City L |
40.3% |
|
Canadian Tire Corp Ltd |
25.6% |
|
Manulife Financial Corp |
8.7% |
|
Power Corp of Canada |
3.2% |
|
Sun Life Financial Inc |
15.9% |
|
TELUS Corp |
19.0% |
|
Thomson Reuters Corp |
21.0% |
|
ARC Resources Ltd |
-11.4% |
|
Enbridge Inc |
32.3% |
|
CGI Inc |
24.6% |
|
Magna International Inc |
46.7% |
|
TransAlta Corp |
-17.3% |
|
TC Energy Corp |
21.9% |
Total Return: 18.9%
TSX Total Return: 10.6%
Outperformance: 8.4%
2013
|
Company |
Return |
|
ARC Resources Ltd |
26.5% |
|
Canadian National
Railway Co |
36.3% |
|
Canadian Pacific Kansas
City L |
60.9% |
|
Enbridge Inc |
10.9% |
|
Loblaw Cos Ltd |
3.3% |
|
Metro Inc/CN |
4.0% |
|
Nexen Energy ULC |
6.5% |
|
Saputo Inc |
-2.1% |
|
TELUS Corp |
16.8% |
|
TC Energy Corp |
7.4% |
|
Bausch Health Cos Inc |
110.0% |
|
Ovintiv Inc |
1.2% |
Total Return: 23.5%
TSX Total Return: 13.0%
Outperformance: 10.5%
2012
|
Company |
Return |
|
ARC Resources Ltd |
2.5% |
|
BCE Inc |
5.8% |
|
Bausch Health Cos Inc |
24.5% |
|
Canadian National
Railway Co |
14.7% |
|
Canadian Pacific Kansas
City L |
48.6% |
|
Enbridge Inc |
16.2% |
|
Enerplus Corp |
-45.3% |
|
Metro Inc/CN |
19.1% |
|
TELUS Corp |
17.5% |
|
TC Energy Corp |
9.9% |
|
Canadian Natural
Resources Ltd |
-23.9% |
|
Ovintiv Inc |
8.1% |
Total Return: 8.2%
TSX Total Return: 7.2%
Outperformance: 1.0%
2011
|
Company |
Return |
|
ARC Resources Ltd |
3.7% |
|
Bausch Health Cos Inc |
68.5% |
|
Brookfield Corp |
-14.1% |
|
Cenovus Energy Inc |
4.1% |
|
Enerplus Corp |
-9.7% |
|
IAMGOLD Corp |
-7.7% |
|
Magna International Inc |
-32.9% |
|
Ovintiv Inc |
-32.9% |
|
Saputo Inc |
0.3% |
|
Teck Resources Ltd |
-40.8% |
|
Nutrien Canada Holdings
ULC |
-25.0% |
|
Enbridge Inc |
39.7% |
|
Fortis Inc/Canada |
1.8% |
Total Return: -3.5%
TSX Total Return: -8.7%
Outperformance: 5.3%
2010
|
Company |
Return |
|
Goldcorp Inc |
11.5% |
|
Agnico Eagle Mines Ltd |
35.0% |
|
ARC Resources Ltd |
34.8% |
|
Bank of Montreal |
7.9% |
|
First Quantum Minerals
Ltd |
35.9% |
|
IAMGOLD Corp |
8.0% |
|
Inmet Mining Corp |
21.6% |
|
Royal Bank of Canada |
-3.8% |
|
Saputo Inc |
31.1% |
|
George Weston Ltd |
28.2% |
|
Potash Corp of
Saskatchewan In |
35.5% |
|
Canadian Oil Sands Ltd |
-5.3% |
|
Imperial Oil Ltd |
0.9% |
|
Suncor Energy Inc |
4.1% |
Total Return: 17.5%
TSX Total Return: 17.6%
Outperformance: -0.1%
2009
|
Company |
Return |
|
Potash Corp of
Saskatchewan In |
28.4% |
|
Goldcorp Inc |
8.3% |
|
Agnico Eagle Mines Ltd |
-9.0% |
|
Bombardier Inc |
10.6% |
|
Kinross Gold Corp |
-13.5% |
|
Loblaw Cos Ltd |
-0.6% |
|
Lundin Mining Corp |
261.3% |
|
Metro Inc/CN |
7.6% |
|
TransAlta Corp |
2.1% |
|
Tim Hortons Inc |
-6.7% |
|
AtkinsRealis Group Inc |
38.0% |
|
Brookfield Corp |
29.8% |
|
Enbridge Inc |
27.5% |
|
Imperial Oil Ltd |
0.2% |
Total Return: 27.4%
TSX Total Return: 35.0%
Outperformance: -7.6%
2008
|
Company |
Return |
|
Cognos Inc |
-0.2% |
|
Potash Corp of
Saskatchewan In |
-37.4% |
|
Goldcorp Inc |
14.2% |
|
Nutrien Canada Holdings
ULC |
-42.0% |
|
BCE Inc |
-35.0% |
|
Canadian Natural
Resources Ltd |
-32.4% |
|
Gildan Activewear Inc |
-65.3% |
|
Imperial Oil Ltd |
-24.4% |
|
TransAlta Corp |
-24.6% |
|
TC Energy Corp |
-14.9% |
|
Canadian Oil Sands Ltd |
-40.0% |
|
Brookfield Corp |
-45.1% |
|
Enbridge Inc |
2.1% |
|
Inmet Mining Corp |
-75.5% |
Total Return: -30.0%
TSX Total Return: -33.0%
Outperformance: 3.0%
2007
|
Company |
Return |
|
Potash Corp of
Saskatchewan In |
158.8% |
|
Canadian Oil Sands Ltd |
24.9% |
|
Nutrien Canada Holdings
ULC |
96.6% |
|
Brookfield Corp |
-4.4% |
|
Cameco Corp |
-15.8% |
|
Canadian Imperial Bank
of Comm |
-25.6% |
|
Enbridge Inc |
2.7% |
|
Royal Bank of Canada |
-5.6% |
|
TransAlta Corp |
29.7% |
|
TC Energy Corp |
3.5% |
|
Imperial Oil Ltd |
28.2% |
Total Return: 26.6%
TSX Total Return: 9.8%
Outperformance: 16.8%
2006
|
Company |
Return |
|
ArcelorMittal Dofasco
Inc |
9.2% |
|
Placer Dome Inc |
-4.2% |
|
Cameco Corp |
28.4% |
|
Canadian Natural
Resources Ltd |
8.4% |
|
Enbridge Inc |
14.4% |
|
Imperial Oil Ltd |
12.5% |
|
Nexen Energy ULC |
16.2% |
|
Suncor Energy Inc |
25.6% |
|
TransAlta Corp |
9.2% |
|
TC Energy Corp |
14.9% |
|
Fairmont Hotels &
Resorts Inc |
0.2% |
|
Glencore Canada Corp |
84.8% |
|
Repsol Oil & Gas
Canada Inc |
-2.9% |
Total Return: 16.7%
TSX Total Return: 17.2%
Outperformance: -0.5%
2005
|
Company |
Return |
|
NOVA Chemicals Corp |
-30.9% |
|
ArcelorMittal Dofasco
Inc |
47.5% |
|
Potash Corp of
Saskatchewan In |
-6.0% |
|
Barrick Mining Corp |
12.7% |
|
Brookfield Corp |
38.0% |
|
Cameco Corp |
76.6% |
|
Canadian Tire Corp Ltd |
24.9% |
|
Husky Energy Inc |
77.5% |
|
Magna International Inc |
-12.9% |
|
Teck Resources Ltd |
70.9% |
|
Bank of Nova Scotia/The |
17.1% |
|
Glencore Canada Corp |
66.8% |
|
TC Energy Corp |
27.6% |
Total Return: 31.5%
TSX Total Return: 24.0%
Outperformance: 7.5%
2004
|
Company |
Return |
|
Rio Tinto Alcan Inc |
-1.6% |
|
Potash Corp of
Saskatchewan In |
79.7% |
|
Vale Canada Ltd |
-14.8% |
|
Placer Dome Inc |
-2.0% |
|
Barrick Mining Corp |
-0.1% |
|
Nutrien Canada Holdings
ULC |
-4.6% |
|
Bank of Montreal |
11.1% |
|
Bank of Nova Scotia/The |
28.6% |
|
Magna International Inc |
-3.5% |
|
Teck Resources Ltd |
70.1% |
|
Brookfield Corp |
66.4% |
|
Kinross Gold Corp |
-18.1% |
|
National Bank of Canada |
18.8% |
|
TC Energy Corp |
11.4% |
Total Return: 17.2%
TSX Total Return: 14.5%
Outperformance: 2.8%
2003
|
Company |
Return |
|
Potash Corp of
Saskatchewan In |
14.3% |
|
Vale Canada Ltd |
54.7% |
|
Petro-Canada |
31.6% |
|
BCE Inc |
5.6% |
|
Bank of Montreal |
32.4% |
|
Brookfield Corp |
29.0% |
|
Cameco Corp |
101.9% |
|
Molson ULC |
9.6% |
|
CP Ships Ltd |
28.1% |
|
TC Energy Corp |
27.1% |
|
Canadian Imperial Bank
of Comm |
51.8% |
|
National Bank of Canada |
37.8% |
Total Return: 35.3%
TSX Total Return: 26.6%
Outperformance: 8.7%
2002
|
Company |
Return |
|
ArcelorMittal Dofasco
Inc |
12.4% |
|
Brookfield Corp |
14.0% |
|
Cameco Corp |
-3.2% |
|
Canadian National
Railway Co |
-13.9% |
|
Imperial Oil Ltd |
3.2% |
|
Molson ULC |
21.0% |
|
Nordion Inc |
16.9% |
|
Suncor Energy Inc |
-5.1% |
|
TC Energy Corp |
20.5% |
|
Westcoast Energy Inc |
3.1% |
|
Canadian Imperial Bank
of Comm |
-17.8% |
|
Toronto-Dominion
Bank/The |
-14.5% |
|
George Weston Ltd |
-11.9% |
Total Return: 1.9%
TSX Total Return: -12.4%
Outperformance: 14.3%
2001
|
Company |
Return |
|
Potash Corp of
Saskatchewan In |
-15.4% |
|
Alberta Energy Co Ltd |
-15.5% |
|
Nutrien Canada Holdings
ULC |
-21.8% |
|
CAE Inc |
-4.3% |
|
Manulife Financial Corp |
-10.4% |
|
Molson ULC |
32.2% |
|
Ovintiv Inc |
10.2% |
|
TransAlta Corp |
2.2% |
|
TC Energy Corp |
20.9% |
|
Westcoast Energy Inc |
20.9% |
|
George Weston Ltd |
24.0% |
Total Return: 3.9%
TSX Total Return: -12.6%
Outperformance: 16.5%